In the unpredictable world of financial markets, emotions often run high. Fear and euphoria can drive decisions, shaping fortunes and narratives. Yet, amidst the ebb and flow of market sentiment, there exists a unique barometer designed to quantify this collective anxiety: the volatility index. Far from a mere statistical figure, this index acts as a window into the market’s perception of risk, offering insights that can be invaluable to investors and traders alike. Understanding its mechanics and implications can transform how one approaches market dynamics, providing a clearer lens through which to view future possibilities and potential turbulence.
Understanding the VIX: The Market’s Fear Gauge
The VIX, often referred to as the stock market’s “fear gauge,” is a real-time market index that represents the market’s expectation of future volatility over the next 30 days. Specifically, it is derived from the price of a wide range of S&P 500 index options. Rather than measuring historical price fluctuations, the VIX focuses on implied volatility, which is the market’s forecast of how much the S&P 500 will move. When market participants anticipate larger, more rapid price swings in the S&P 500, the VIX tends to rise. Conversely, when expectations are for calm, stable movements, the VIX typically falls. This forward-looking nature makes it a powerful indicator, distinguishing it from historical volatility measures. For those seeking to comprehend what is the volatility index and how to use it, grasping its foundation in implied volatility is paramount.
The S&P 500 and VIX Chart: A Dynamic Duo
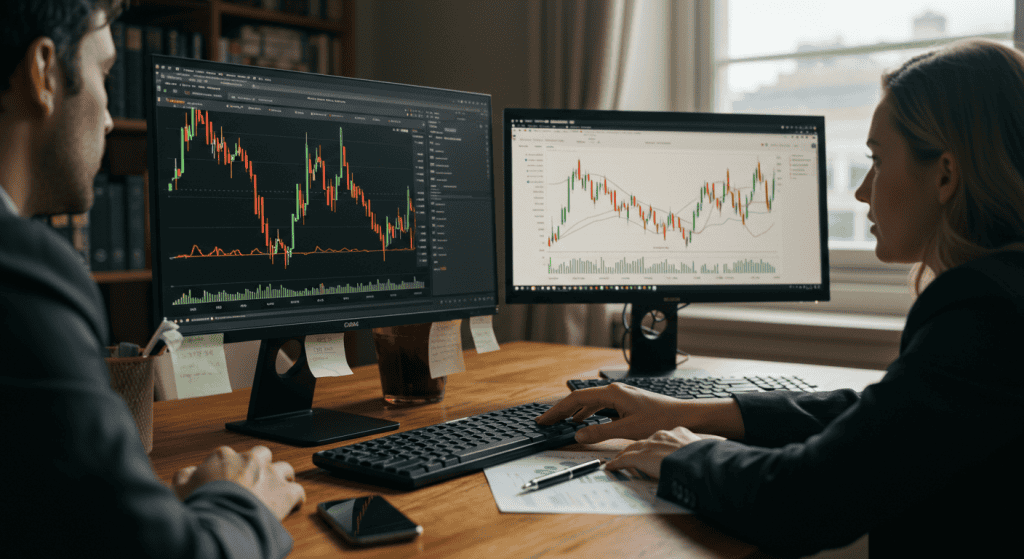
One of the most observed characteristics of the VIX is its compelling inverse relationship with the S&P 500 index. When the S&P 500 experiences sharp declines, signaling investor unease or a potential downturn, the VIX typically surges. This phenomenon highlights moments of heightened market sentiment, where fear prompts investors to seek protection, driving up the prices of S&P 500 options, and consequently, the VIX. Conversely, during periods of market rallies or sustained upward trajectories in the S&P 500, the VIX often remains subdued, reflecting investor complacency and a perceived lower risk environment. Analyzing the relationship between s&p 500 and vix chart can offer a visual representation of this dynamic, providing immediate insights into the current emotional state of the market. This impact of geopolitical events on market volatility can often be seen playing out in real-time on such charts.
Trading the VIX: Strategies for Beginners
While the VIX itself is not directly tradable, investors can gain exposure to it through various financial instruments. The primary methods include VIX futures and options, as well as VIX-linked Exchange Traded Funds (ETFs) and Exchange Traded Notes (ETNs). These products allow individuals to speculate on the future direction of market volatility. However, it is essential to understand that VIX-linked products are complex and often designed for short-term trading due to their inherent decay from contango, where future prices are higher than spot prices. For those exploring how to trade the vix index for beginners, a thorough understanding of these instruments, their decay characteristics, and the risks involved is non-negotiable. Some use VIX products as a form of hedging against market downturns, seeking to offset potential losses in their equity portfolios during periods of increased volatility.
Using VIX as a Contrarian Indicator
Beyond its role as a volatility measure, the VIX often serves as a powerful contrarian indicator for discerning market turning points. Historically, extremely high VIX readings – often above 30 or 40 – have coincided with periods of extreme investor fear, panic selling, and often, significant market bottoms. At such junctures, many investors are capitulating, creating potential buying opportunities for those willing to go against the prevailing sentiment. Conversely, when the VIX drops to unusually low levels, signaling widespread complacency and a lack of perceived risk, it can sometimes precede significant market tops or corrections. Such periods indicate that investors may be underestimating potential risks, making the market vulnerable to unexpected shocks. Recognizing these patterns can equip investors with a unique perspective, enabling them to question the herd mentality and make more informed decisions. It can also help differentiate between a market correction vs a crash, offering clues about the severity and duration of market declines.
